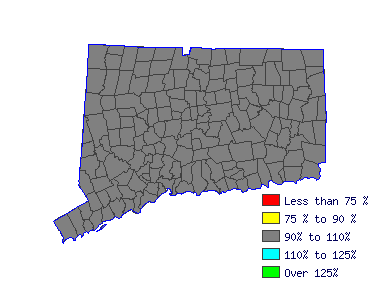
| North Central Workforce Investment Area (1Q 2015) |
| All Industry |
| Estimated employment | 4,790 |
| Mean wage | $72,513 |
| Entry wage | $51,023 |
| 10th percentile wage | $46,905 |
| 50th percentile wage | $74,209 |
| 90th percentile wage | $96,659 |
 | | Top Employing Industries |
| Industry | Employment | % |
| Education & Health Services | 4,790 | 100.0% |
 |
| Best Paying Industries |
| Industry | Employment | Median
Wage |
| Education & Health Services | 4,790 | 72,513 |
 | |
 |
| Elementary School Teachers, Ex. Special Education (25-2021) |
| Teach pupils in public or private schools at the elementary level basic academic, social, and other formative skills. Exclude "Special Education Teachers" (25-2041 through 25-2043). |
| Mean Wage History |
| Year | This Occupation | Compared to
Occupational Group | Difference |
| Current | $72512.96 | | $59318.19 |
| $13194.77 | | 2014 | $72160.38 | +.5% | $59029.77 |
+.5% | $13130.61 | | 2013 | $70808.85 | +1.9% | $57924.16 |
+1.9% | $12884.68 | | 2012 | $69457.31 | +1.9% | $56818.56 |
+1.9% | $12638.75 | | 2011 | $68105.77 | +2.0% | $55712.95 |
+2.0% | $12392.82 | | 2010 | $67048.04 | +1.6% | $54847.69 |
+1.6% | $12200.35 | | 2009 | $65872.79 | +1.8% | $53886.30 |
+1.8% | $11986.50 | | 2008 | $65167.64 | +1.1% | $53309.46 |
+1.1% | $11858.18 | | 2007 | $63228.48 | +3.1% | $51723.15 |
+3.1% | $11505.33 | | 2006 | $61113.03 | +3.5% | $49992.64 |
+3.5% | $11120.39 |
| Year | This Occupation | Compared to
All Occupations | Difference |
| Current | $72512.96 | | $56151.41 |
| $16361.55 | | 2014 | $72160.38 | +.5% | $55693.41 |
+.8% | $16466.98 | | 2013 | $70808.85 | +1.9% | $54502.59 |
+2.2% | $16306.25 | | 2012 | $69457.31 | +1.9% | $53403.38 |
+2.1% | $16053.93 | | 2011 | $68105.77 | +2.0% | $52487.37 |
+1.7% | $15618.40 | | 2010 | $67048.04 | +1.6% | $51662.96 |
+1.6% | $15385.08 | | 2009 | $65872.79 | +1.8% | $50792.75 |
+1.7% | $15080.04 | | 2008 | $65167.64 | +1.1% | $50105.74 |
+1.4% | $15061.90 | | 2007 | $63228.48 | +3.1% | $48823.33 |
+2.6% | $14405.15 | | 2006 | $61113.03 | +3.5% | $47266.11 |
+3.3% | $13846.92 |
|
Reference Date: 1st Quarter 2015 |
State of Connecticut Department of Labor Office of Research
200 Folly Brook Boulevard Wethersfield, CT 06109
Phone: 860-263-6285 |

| | | | |
| Top Areas For This Occupation |
| Best Pay |
| Southwest |
75,275 |
4,170 |
| North Central |
72,513 |
4,790 |
| Northwest |
70,161 |
2,940 |
| South Central |
70,075 |
2,830 |
| Eastern |
67,316 |
1,810 |
|
| Highest Employment |
| North Central |
72,513 |
4,790 |
| Southwest |
75,275 |
4,170 |
| Northwest |
70,161 |
2,940 |
| South Central |
70,075 |
2,830 |
| Eastern |
67,316 |
1,810 |
|
|
 |
|


